
Florida U.S. Senator Bill Nelson is leading Gov. RICHARD LYNN SCOTT
48-42 in latest University of North Florida poll.
Based on current committee assignments, IF the Democrats take the Senate and Senator Nelson is re-elected, it looks like Senator Nelson might become Chair of the Senate Committee on Commerce, Science and Transportation, which has suzerainty over NASA. Senator Nelson was a Space Shuttle astronaut.
The Committee also has jurisdiction over:
- Coast Guard.
- Coastal zone management.
- Communications.
- Highway safety.
- Inland waterways, except construction.
- Interstate commerce.
- Marine and ocean navigation, safety, and transportation, including navigational aspects of deepwater ports.
- Marine fisheries.
- Merchant marine and navigation.
- Nonmilitary aeronautical and space sciences.
- Oceans, weather, and atmospheric activities.
- Panama Canal and interoceanic canals generally, except as provided in subparagraph (c).
- Regulation of consumer products and services, including testing related to toxic substances, other than pesticides, and except for credit, financial services, and housing.
- Regulation of interstate common carriers, including railroads, buses, trucks, vessels, pipelines, and civil aviation.
- Science, engineering, and technology research and development and policy.
- Sports.
- Standards and measurement.
- Transportation.
- Transportation and commerce aspects of Outer Continental Shelf lands.
{It is also required] to study and review, on a comprehensive basis, all matters relating to science and technology, oceans policy, transportation, communications, and consumer affairs, and report thereon from time to time.
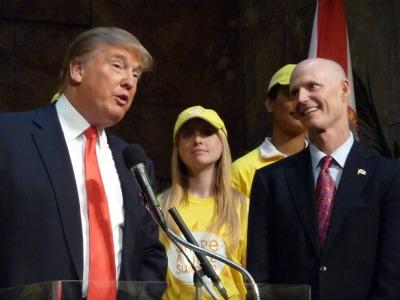
If re-elected with a Democratic majority in the U.S. Senate, Senator Bill Nelson is in a position to help protect our coasts and oceans from global warming and global ocean level rise and from the depredations of offshore oil drilling, Big Oil and the perfidy of the DONALD TRUMP administration, of which Governor RICHARD LYNN SCOTT is a fawning supporter. I strongly support Senator Bill Nelson's re-election -- he's earned it.


Media Contact: Joanna Norris, Director
Department of Public Relations
(904) 620-2102
Methodology Results Contact: Dr. Michael Binder
Public Opinion Research Lab Director
(904) 620-2784
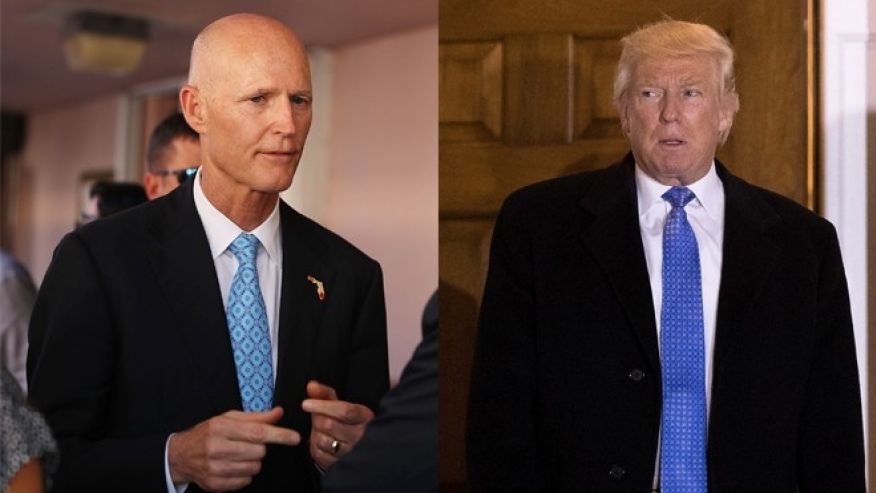
New UNF Poll Shows Sen. Bill Nelson Leading Gov. Rick Scott in 2018 Senate Election
President Donald Trump’s Job Approval Rating Low But Improving
The Public Opinion Research Lab at the University of North Florida has a new poll that reveals Sen. Bill Nelson in the lead for the upcoming Senate election, with Gov. Rick Scott trailing close behind. The survey also shows that President Trump’s job approval rating has risen some since last fall.
The poll, comprised of Florida registered voters, shows that of likely voters in 2018, 48 percent plan to vote for Nelson, the Democratic candidate in the upcoming election for U.S. Senate, while 42 percent plan to vote for Scott, the Republican. Of those likely voters, 7 percent don’t know who their choice will be.
Regarding the U.S. House of Representatives, when asked who they would vote for if the election were held today, 42 percent of likely voters indicated they would vote for the Democratic candidate, 40 percent would plan to vote for the Republican candidate and 14 percent didn’t know.
“Even though it appears Nelson has a reasonable lead in the poll, the election results will ultimately get determined by who shows up in November,” said Michael Binder, faculty director of the Public Opinion Research Lab at UNF. “Historically, Republicans have enjoyed a turnout advantage in midterms, but with the current mood of the country, and a large number of Republican retirements, Democrats are optimistic about an impending blue wave.”
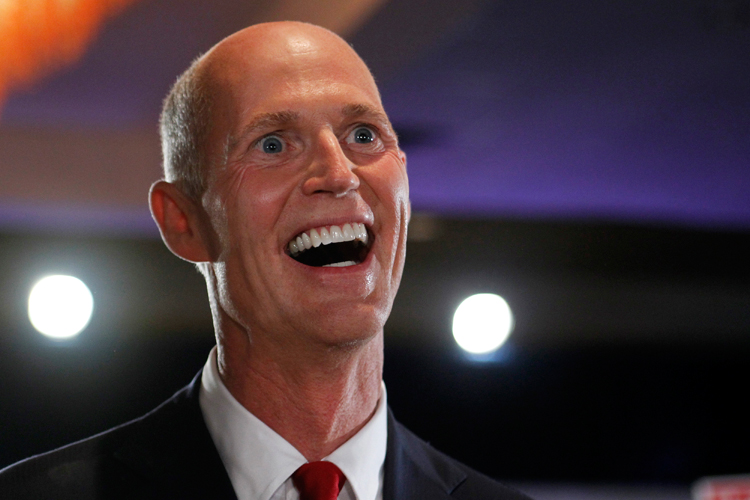
Of registered voters who were asked whether they approve or disapprove of the way Nelson is handling his job as senator, 52 percent of registered voters claim to somewhat or strongly approve, with only 20 percent somewhat or strongly disapproving. Notably, 26 percent of voters expressed they don’t know how Nelson is handling his job. When asked about the way Scott is handling his job as Florida governor, 63 percent reported to strongly or somewhat approve, with 31 percent disapproving either somewhat or strongly.
“Both senate candidates have net positive job approval ratings of 32 percentage points,” said Binder. “This high level of job approval is very unusual and is going to lead to a hotly contested election.”
When asked about how Sen. Marco Rubio is handling his job, 55 percent strongly or somewhat approve, compared to the 35 percent who reported to somewhat or strongly disapprove.
When asked about President Donald Trump’s job approval rating, 43 percent of the overall sample strongly or somewhat approve of how he’s handling his job, with 53 percent disapproving somewhat or strongly. A large amount of registered Democrats—87 percent—disapprove of Trump, while only 16 percent of registered Republicans disapprove. On the contrary, Trump held 81 percent job approval among registered Republicans, compared to 40 percent approval among nonpartisans and a dismal 10 percent job approval among registered Democrats.
“Most presidents would consider 43 percent approval and net negative 10 percentage points a troubling number, but Trump’s approval is up 6 percentage points from his approval level in October, and his net negatives have improved by 12 percentage points,” noted Binder.
In light of the recent investigation into Russian involvement in the 2016 election, when asked about the way Robert Mueller is handling his job as Special Counsel for the United States Department of Justice, 40 percent of registered voters somewhat or strongly approve, 28 percent of voters somewhat or strongly disapprove and 29 percent of voters don’t know how he’s handling his job.
“Even though Mueller is acting in a legal capacity, and has a 12-percentage point net positive job approval, there are partisan divisions as Democrats are much more supportive than Republicans in their views on Mueller,” said Binder.
Survey Results
If the 2018 election for U.S. senator from Florida were being held today, how would you vote if the candidates were…
Answer Options
|
February 2018
Florida Likely Voters
n=429**
|
October 2017
Florida Likely Voters n=706*
|
February 2017
Florida Registered Voters
n=957
|
Bill Nelson, the Democrat
|
48%
|
37%
|
44%
|
Rick Scott, the Republican
|
42%
|
36%
|
38%
|
Someone else
|
2%
|
7%
|
3%
|
Don’t Know
|
7%
|
20%
|
12%
|
Refusal
|
-
|
-
|
-
|
*Respondents that indicated that they would vote in the upcoming senatorial election
** Respondents that indicated active voting and/or enthusiasm for the upcoming midterm election
Answer Options
|
Democrats
|
Republicans
|
NPA/Others
|
Bill Nelson, the Democrat
|
86%
|
14%
|
42%
|
Rick Scott, the Republican
|
7%
|
79%
|
42%
|
Someone else
|
2%
|
1%
|
6%
|
Don’t Know
|
5%
|
7%
|
10%
|
Refusal
|
-
|
-
|
If the election for the U.S. House of Representatives were being held today, would you vote for (the Democratic candidate) or (the Republican candidate) in your congressional district?
Answer Options
|
February 2018
Florida Likely Voters
n=429**
|
The Democratic candidate
|
42%
|
The Republican candidate
|
40%
|
Other
|
5%
|
Don’t Know
|
13%
|
Refusal
|
-
|
Answer Options
|
Democrats
|
Republicans
|
NPA/Others
|
The Democratic candidate
|
82%
|
6%
|
35%
|
The Republican candidate
|
6%
|
82%
|
26%
|
Other
|
2%
|
2%
|
13%
|
Don’t Know
|
10%
|
10%
|
26%
|
Refusal
|
-
|
-
|
-
|
Do you approve or disapprove of the way that Bill Nelson is handling his job as United States senator?
Answer Options
|
February 2018
Florida Registered Voters
n=619
|
October 2017
Florida Registered Voters n=834
|
February 2017
Florida Registered Voters
n=945
|
Strongly Approve
|
19%
|
12%
|
13%
|
Somewhat Approve
|
33%
|
23%
|
29%
|
Somewhat Disapprove
|
8%
|
9%
|
16%
|
Strongly Disapprove
|
12%
|
6%
|
12%
|
Don’t Know
|
26%
|
49%
|
29%
|
Refusal
|
2%
|
1%
|
-
|
Answer Options
|
Democrats
|
Republicans
|
NPA/Others
|
Strongly Approve
|
28%
|
12%
|
14%
|
Somewhat Approve
|
41%
|
22%
|
38%
|
Somewhat Disapprove
|
5%
|
14%
|
3%
|
Strongly Disapprove
|
7%
|
22%
|
8%
|
Don’t Know
|
19%
|
28%
|
35%
|
Refusal
|
-
|
2%
|
2%
|
Do you approve or disapprove of the way that Rick Scott is handling his job as governor of Florida?
Answer Options
|
February 2018
Florida Registered Voters
n=619
|
October 2017
Florida Registered Voters n=834
|
February 2017
Florida Registered Voters
n=957
|
Strongly Approve
|
29%
|
26%
|
17%
|
Somewhat Approve
|
34%
|
33%
|
29%
|
Somewhat Disapprove
|
14%
|
15%
|
14%
|
Strongly Disapprove
|
17%
|
13%
|
26%
|
Don’t Know
|
5%
|
11%
|
14%
|
Refusal
|
1%
|
1%
|
-
|
Answer Options
|
Democrats
|
Republicans
|
NPA/Others
|
Strongly Approve
|
12%
|
51%
|
25%
|
Somewhat Approve
|
30%
|
31%
|
41%
|
Somewhat Disapprove
|
19%
|
8%
|
14%
|
Strongly Disapprove
|
32%
|
3%
|
14%
|
Don’t Know
|
6%
|
6%
|
5%
|
Refusal
|
-
|
1%
|
1%
|
Do you approve or disapprove of the way that Marco Rubio is handling his job as United States Senator?
Answer Options
|
February 2018
Florida Registered Voters
n=619
|
October 2017
Florida Registered Voters n=834
|
February 2017
Florida Registered Voters
n=956
|
Strongly Approve
|
17%
|
13%
|
15%
|
Somewhat Approve
|
38%
|
29%
|
25%
|
Somewhat Disapprove
|
14%
|
18%
|
17%
|
Strongly Disapprove
|
22%
|
19%
|
31%
|
Don’t Know
|
9%
|
20%
|
12%
|
Refusal
|
1%
|
1%
|
-
|
Answer Options
|
Democrats
|
Republicans
|
NPA/Others
|
Strongly Approve
|
7%
|
31%
|
13%
|
Somewhat Approve
|
29%
|
41%
|
46%
|
Somewhat Disapprove
|
21%
|
11%
|
9%
|
Strongly Disapprove
|
36%
|
9%
|
18%
|
Don’t Know
|
8%
|
7%
|
12%
|
Refusal
|
-
|
2%
|
1%
|
Do you approve or disapprove of the way that Donald Trump is handling his job as president of the United States?
Answer Options
|
February 2018
Florida Registered Voters
n=619
|
October 2017
Florida Registered Voters n=834
|
February 2017
Florida Registered Voters
n=957
|
Strongly Approve
|
30%
|
19%
|
28%
|
Somewhat Approve
|
13%
|
18%
|
16%
|
Somewhat Disapprove
|
9%
|
9%
|
7%
|
Strongly Disapprove
|
44%
|
50%
|
44%
|
Don’t Know
|
2%
|
2%
|
4%
|
Refusal
|
2%
|
1%
|
-
|
Answer Options
|
Democrats
|
Republicans
|
NPA/Others
|
Strongly Approve
|
4%
|
64%
|
22%
|
Somewhat Approve
|
6%
|
17%
|
18%
|
Somewhat Disapprove
|
11%
|
4%
|
13%
|
Strongly Disapprove
|
76%
|
12%
|
44%
|
Don’t Know
|
2%
|
2%
|
1%
|
Refusal
|
1%
|
1%
|
3%
|
Do you approve or disapprove of the way that Robert Mueller is handling his job as Special Counsel for the United States Department of justice?
Answer Options
|
February 2018
Florida Registered Voters
n=619
|
Strongly Approve
|
19%
|
Somewhat Approve
|
21%
|
Somewhat Disapprove
|
11%
|
Strongly Disapprove
|
17%
|
Don’t Know
|
29%
|
Refusal
|
3%
|
Answer Options
|
Democrats
|
Republicans
|
NPA/Others
|
Strongly Approve
|
33%
|
7%
|
13%
|
Somewhat Approve
|
22%
|
21%
|
21%
|
Somewhat Disapprove
|
9%
|
16%
|
7%
|
Strongly Disapprove
|
11%
|
25%
|
16%
|
Don’t Know
|
24%
|
28%
|
39%
|
Refusal
|
1%
|
3%
|
4%
|
How often do you vote in non-presidential elections? Rate your involvement on a scale of one to five, where one is never and five is always.
Answer Options
|
February 2018
Florida Registered Voters
n=619
|
One (never)
|
17%
|
Two
|
9%
|
Three
|
17%
|
Four
|
14%
|
Five (always)
|
43%
|
Don’t Know
|
1%
|
Refusal
|
<1 p="">
|
Thinking about the upcoming Florida midterm election in November, overall, would you say you are:
Answer Options
|
February 2018
Florida Registered Voters
n=619
|
Not at all enthusiastic
|
27%
|
Somewhat enthusiastic
|
44%
|
Very enthusiastic
|
25%
|
Don’t Know
|
3%
|
Refusal
|
1%
|
Survey Demographics
Party Registration
|
Florida Registered Voters n=619
|
Republican
|
35%
|
Democrat
|
38%
|
NPA and other
|
27%
|
Age
|
Florida Registered Voters n=619
|
18 to 24
|
9%
|
25 to 34
|
15%
|
35 to 44
|
14%
|
45 to 55
|
16%
|
56 to 64
|
18%
|
65 and older
|
28%
|
Race
|
Florida Registered Voters n=619
|
White (not Hispanic)
|
64%
|
Black (not Hispanic)
|
13%
|
Hispanic
|
16%
|
Other
|
7%
|
Sex
|
Florida Registered Voters n=619
|
Male
|
46%
|
Female
|
54%
|
Telephone
|
Florida Registered Voters n=619
|
Landline
|
14%
|
Cell phone
|
85%
|
Don’t Know
|
-
|
Refusal
|
1%
|
Education
|
Florida Registered Voters n=619
|
Less than high school
|
3%
|
High school graduate
|
14%
|
Some college
|
51%
|
College graduate
|
19%
|
Post graduate degree
|
13%
|
Don’t Know
|
-
|
Refusal
|
-
|
Income
|
Florida Registered Voters n=619
|
Less than $25,000
|
11%
|
$25,000 to $50,000
|
21%
|
$50,000 to $75,000
|
21%
|
$75,000 to $100,000
|
13%
|
Above $100,000
|
21%
|
Don’t Know
|
5%
|
Refusal
|
9%
|
Survey language completed in…
|
Florida Registered Voters n=619
|
English
|
98%
|
Spanish
|
2%
|
Methodology
The University of North Florida (UNF), Florida Statewide Poll was conducted by the Public Opinion Research Lab (PORL) at UNF Monday, January 29, through Sunday, February 4, by live callers via the telephone, and calls were made from 5 p.m. to 9 p.m. Monday through Friday, 12 p.m. to 9 p.m. Saturday and 11 a.m. to 2:30 p.m. Sunday. The sample of phone numbers was created through the voter file provided by Florida’s Division of Elections September 2017 update and selected through the use of probability sampling among Florida registered voters in the Florida voter file. Interviews were conducted in English and Spanish by UNF undergraduate and graduate students. Overall, there were 619 completed surveys of Florida registered voters, 18 years of age or older.
To determine likely voters, respondents were asked two questions related to the upcoming midterm elections. First, they were asked on a scale of one (never) to five (always), how often do they vote in non-presidential elections. Second, respondents were asked about their enthusiasm for the upcoming election (not at all, somewhat or very enthusiastic). Respondents who answered four or five for the frequency of voting question, or answered a three to the frequency of voting question and also answered somewhat or very enthused about the upcoming midterm elections were included as likely voters.
The margin of sampling error for the total sample is +/- 3.9 percentage points.The margin of error for likely voters in the November 2018 midterm election is +/- 4.7 percentage points. This study had a 13.8% response rate. The American Association of Public Opinion Research (AAPOR) Response Rate 3 (RR3) calculation was used which consists of an estimate of what proportion of cases of unknown eligibility are actually eligible. The breakdown of completed responses on a landline phone to a cell phone was 27 to 73 percent. A single interviewer, through hand dialing, upon reaching the specific registered voter as identified in the Florida voter file, asked the respondent to participate, regardless of landline telephone or cell phone.
To ensure a representative sample being collected, the state was stratified using the 10 Florida designated market areas (DMA). DMAs are defined as regions where the population can receive the same or similar television and radio station offerings, as well as other types of media including newspapers and Internet content. In addition, because of Miami-Dade County’s unique population, it was separately accounted for in its own strata, creating 11 strata from the 10 DMAs. Quotas were placed on each of these stratified areas to ensure a proportionate amount of completed surveys from across the state. Data were then weighted by partisan registration, gender, race, age, and education. Education weights were created from the 2016 American Community Survey (ACS). Partisan registration, gender, race, and age weights were created from the September 2017 update of the Florida voter file to match the active registered voters in the state of Florida. These demographic characteristics were pulled from the voter file list. All weighted demographic variables were applied using the SPSS version 23 rake weighting function. There were no statistical adjustments made due to design effects. This survey was sponsored by the UNF PORL and directed by Dr. Michael Binder, UNF associate professor of political science.
The PORL is a full-service survey research facility that provides tailored research to fulfill each client’s individual needs from political, economic, social and cultural projects. The PORL opened in 2001 and is an independent, non-partisan center, a charter member of the American Association for Public Opinion Research Transparency Initiative and a member of the Association of Academic Survey Research Organization. For more information about methodology, contact Dr. Binder at porl@unf.edu or at (904) 620-2784.
No comments:
Post a Comment